With minimal code, you can easily integrate our embeddable charts and graphs into your website, blog, or application. Here’s how you can add Reviewer.ly data visualizations to your website or profile page:
1. On Reviewer.ly, find your profile or the profile of the author you would like to feature.
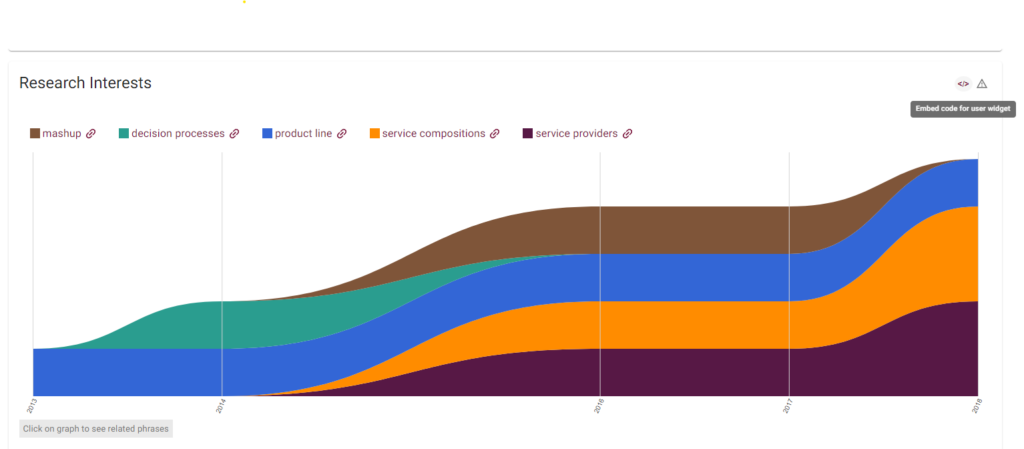
2. Click on the </> icon the top right of the data chart or visualization.
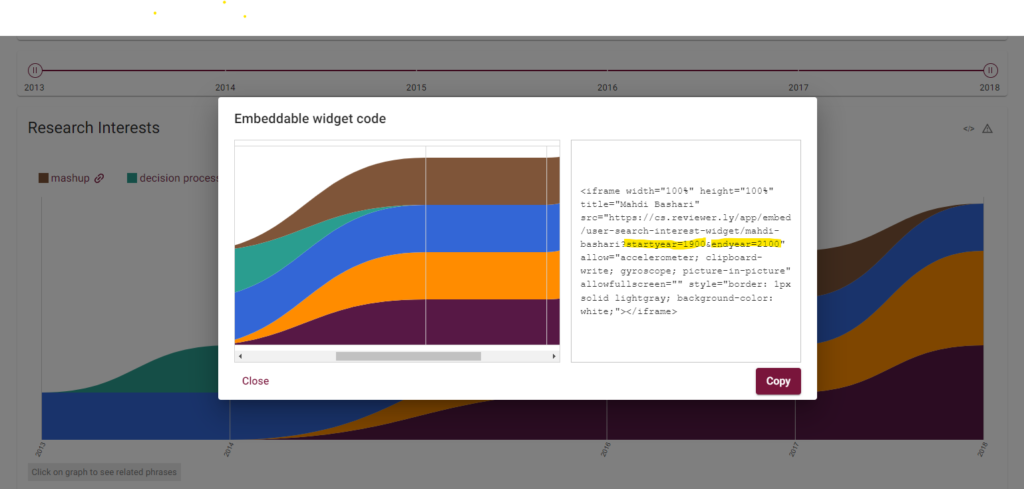
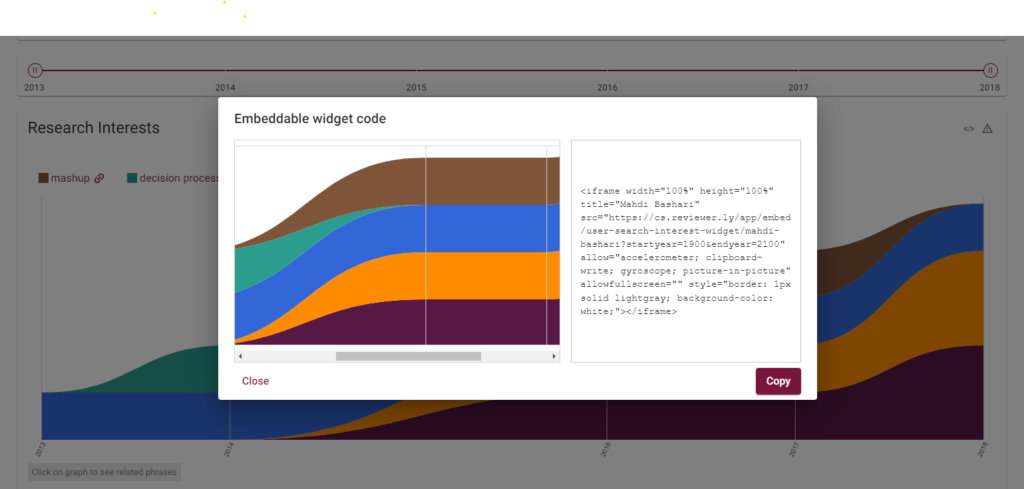
3. A pop up will appear. Copy the iframe code from the right panel.
4. Go to your website or app. In the “Edit in HTML” view, paste the code in the desired location, and publish the page or content.
Tip: you can also customize the start year and end year of the graphic to isolate a specific range of activity for the author.